
Popularity Contests & Data Analysis for the Masses
LabPlot is a useful piece of software. Dump a bunch of numeric data into LabPlot and it produces graphs that help you make sense of it all. You can use it to record atmospheric temperatures and figure out how climate change is affecting your back garden, or give it the daily number of infected by the Coronavirus and decide if it is safe to go shopping for toilet roll or not.
Given the right sources, you can also use it to track if your Free Software project is being adopted at increasing rates; alternatively, you may find you need to ramp up your communication activities to boost it.
The thing is, I have been hanging out (virtually) quite a bit with Alexander Semke lately. Alexander is the project leader of LabPlot, and we get up to all kinds of high jinks.
Yesterday, for instance, we came across an interesting service offered by a well-known Free Software project. Turns out the people of the Debian project, creators of probably one of the oldest and most famous Linux distributions, collect data from users that tells us how popular each package in their distro is.
The service is called the Debian Popularity Contest. Although I was aware of it and had been mining it for several years, what I hadn’t realised is that they also have this nifty graphing service. Type in the name of a package; for example, plasma-workspace, set the period you want to see (say, from 2015-01-01 to 2019-12-31), press the [Go] button, and you get a nice simple graph that shows you its rate of adoption.
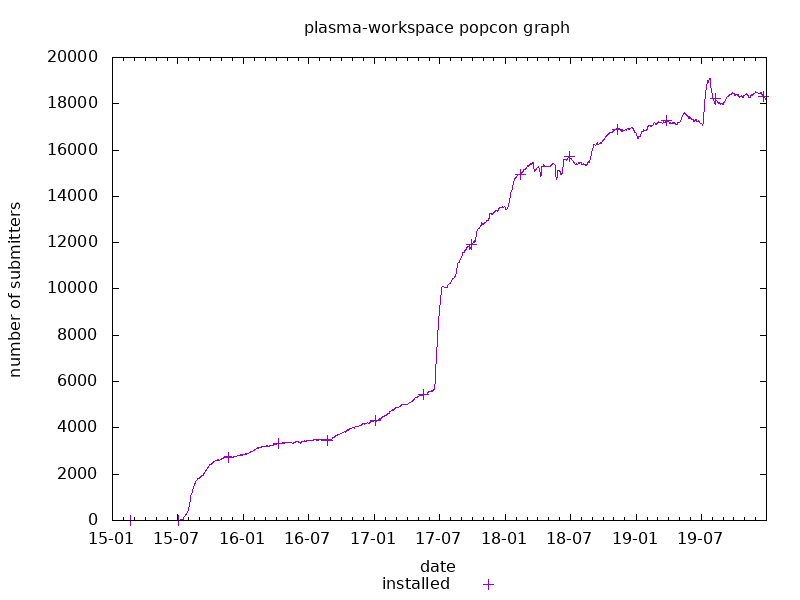
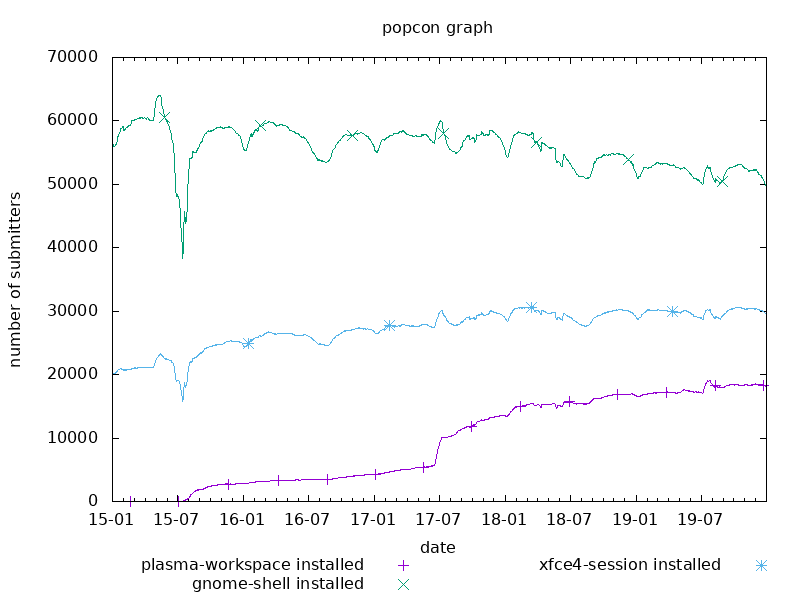
That big jump round about July 2017 was due to the fact that Debian released a new version of their operating system: Debian 9, aka “Stretch”. There hadn’t been a new release in over two years, so the jump is also visible in the other two popular desktops, GNOME and XFCE. And that is another nice thing you can do with Debian’s online plotting utility: you can compare several packages at the same time:
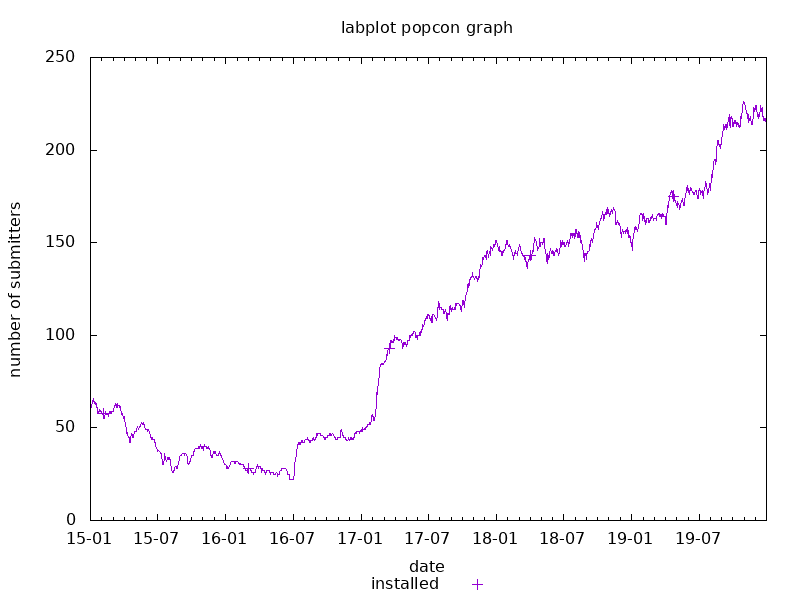
Apart from desktops, Debian’s repositories contain a comprehensive variety of Free Software packages, which means you can query for practically any random application and it is very likely you will get something back:
Of course, this information is partial. Firstly, it comes from a distro which is not that massively used by end users (the audience we at KDE are interested in). Secondly, submitting metrics to Debian is opt-in (as it should be). This means the data comes from only a subset of Debian users – those who don’t mind that a script occasionally uploads information about their systems to Debian’s servers.
Still, partial is better than nothing.
Social Media
Talking of incomplete data, in related news I have started trying to bash some meaning out of the raw data we collect from several sources. For example, Twitter.
This came about as an intermediate step to getting something else done, but it is interesting in itself (interesting being a subjective term here). So I have been copying and collating the data we download on a monthly basis from Twitter and putting it into a spreadsheet. Although there are no pretty graphs yet, you can still figure out a lot just by looking at the numbers.
Here are some of the things I have discovered:
- Over the last year (from May 2019 to April 2020, both inclusive), we have posted on average a bit more than 1 tweet a day for every work day.
- The days we post most are on Wednesdays and Thursdays, and the times we favour are between 11:00 and 12:59 UTC.
- However, the data shows that the best time of day for people to see our posts is somewhere between 08:00 and 08:59 UTC. This is something we were already counting on and were recommending to other KDE projects when planning their posts.
- Also, the best day by far is Wednesday, not Tuesday as we had always assumed. This doesn’t mean Tuesday is bad, just that Wednesday is better.
- These are also the same times and days when followers are more active, and engage (like, re-tweet and reply to tweets) more. A tweet posted between 08:00 and 08:59 UTC will be seen by about 35% more people than one posted between 11:00 and 12:59 UTC. Typically, it will also receive nearly 80% more engagements.
Why are we posting so much at the later time, then? My guess is because that is usually the time projects make their releases public, although that can’t be the whole story… Maybe it is because at 10 AM we are busy having a snack and a coffee? That may also be why people are reading us more at that time too: people walking around with mugs of joe in one hand, scrolling through Twitter on their phones in the other…
One thing is clear: this needs more research. In any case, something to consider and remind our fellow contributors about.
Although we do not have enough data to confirm it as a “thing”, it also turns out that the 21:00 to 21:59 UTC timeslot looks promising. I guess it is always 10 AM somewhere in the world.
Further Work
So far, I have compiled a year of data — well, 13 months really, because I can’t count. This amount of data is okayish to start seeing trends, but probably insufficient to figure out hard and fast guidelines. However, before I continue with Twitter, I want to progressively move through other sources. I suspect that different platforms will show different trends because people use different social media platforms for different things.
I also want to classify posts by topic, figure out the most popular themes, and determine from which platform we can expect the best response to each theme so we can tailor posts to the preferences of each audience. I have already started doing that, and compiled a list of topics, but it probably needs refining. I would also be interested in plugging some sort of language analysis script into the spreadsheet; something that will allow us to extract keywords from each post to see if they affect its popularity.
That said, popularity isn’t everything, as I will explain in an upcoming post.
To be continued.